This article shows how to collect the Web Browser log. This log is very useful to identify browser independent issues in the Content Manager.
Note: The following steps require the latest version of Google Chrome.
-
Start Google Chrome and navigate to the page with the problem.
-
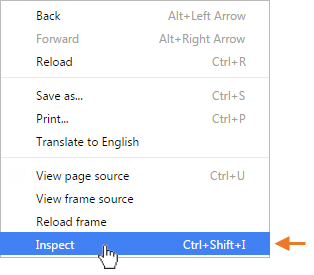
Right click on the page and select Inspect to open the developer tools.
-
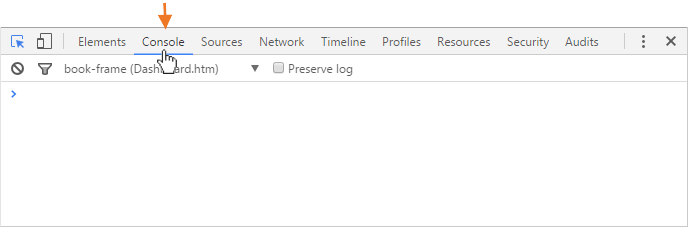
Once the developer tools show click on the Console link to navigate to the console.
-
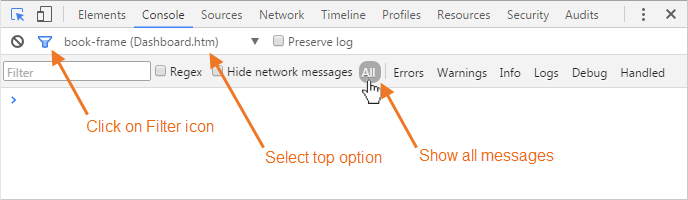
Now the console output is being displayed. Please make sure that all filters are removed and the full page context is displayed.
-
Either make a screenshot of the console and send to tech.support@snapcomms.com (only if there's no scrollbar and all messages are visible)
Hint: You can undock the console and increase the window size if the console can not show all of the text, or select all entries in the console and copy and paste it to an email to tech.support@snapcomms.com.
To undock the console, click on the 3 dots next to the X within the console (right hand side).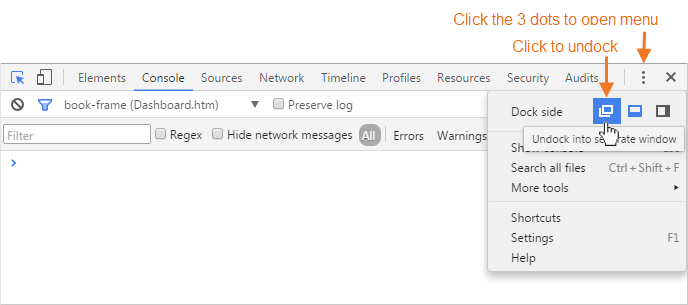
Comments
0 commentsArticle is closed for comments.